Let the Data do the Talking: Optimizing visualizations for transparency and readability
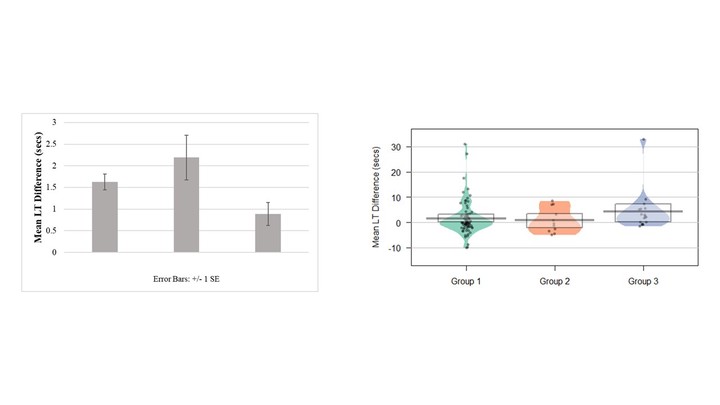 Figure 1 (left) and Figure 2 (right) emphasize how emphasizing data transparency and accounting for perceptual and cognitive biases can improve data vizualizations
Abstract
Communicating results accurately and effectively is a key component of the research process. Data visualization is one way to communicate results while helping readers understand the main findings of a study (Pastore, Lionetti, & Altoè, 2017). Creating visualizations is very accessible with today’s technology, but these automatically-generated graphs are not optimal for visualizing infant data, which has small sample sizes and large variability. For example, bar plots hide larger trends and can lead to misinterpretations of the data (Saxon, 2015). As a result, there has been a push in infant research to move towards visualizations showing the underlying distribution of the data and individual data points, such as pirate plots (“#barbarplots,” 2016; Tsuji, 2018). Despite the improvements such changes make in communicating data and results, visualizations of infant data can be further enhanced by incorporating knowledge from the fields of human perception and cognition.
Accounting for pre-existing perceptual biases can improve visualizations, and make them easier to interpret. For example, groups can be depicted by incorporating Gestalt principles, like proximity and color, into the visualization (Kobourov, Mchedlidze, & Vonessen, 2015). Color is a particularly important element in visualizations. When choosing what colors to use, researchers should consider the underlying structure of their data (i.e., continuous, ordinal, or nominal; Levkowitz, 1996; Silva, Sousa Santos, & Madeira, 2011). For instance, when depicting nominal data, the colors representing each group should be perceived as discrete and lacking an inherent order. When choosing a color scheme, researchers can turn to several online tools that accommodate data structure and perceptual biases (e.g. ColorBrewer; Brewer & Harrower, 2013).
Second, taking the limitations on a reader’s memory into account can lead to visualizations that enhance the reader’s understanding. The cognitive system can only process a limited amount at any one time, so it is important to draw the reader’s attention to the most relevant information. The use of cues such as color, arrows, and text can reduce the load on a reader’s working memory (McCrudden & Rapp, 2017), allowing them to focus on interpreting the findings instead of trying to remember what elements in the graph are important.
For an example of how to incorporate these suggestions, see Figures 1 and 2 (above), which visualize the same data. Figure 1 (right) was created in Microsoft Excel. It is uninformative about individual infants’ performance, and there are no cues to direct the reader’s attention. Figure 2 (left) was made in R and is more transparent about the underlying structure of the data. It shows individual data points, the distribution, and the 95% confidence interval around the mean. While this graph shows more information, it is not difficult to read, because perceptual and cognitive biases were considered in its design. Data points are grouped together using Gestalt principles, and the use of color emphasizes the shape of the data’s distribution, directing the reader to the most important components of the visualization.
By utilizing perceptual biases in the design of data visualizations, infant researchers can overcome challenges around cognitive limits and ultimately better communicate their findings.